
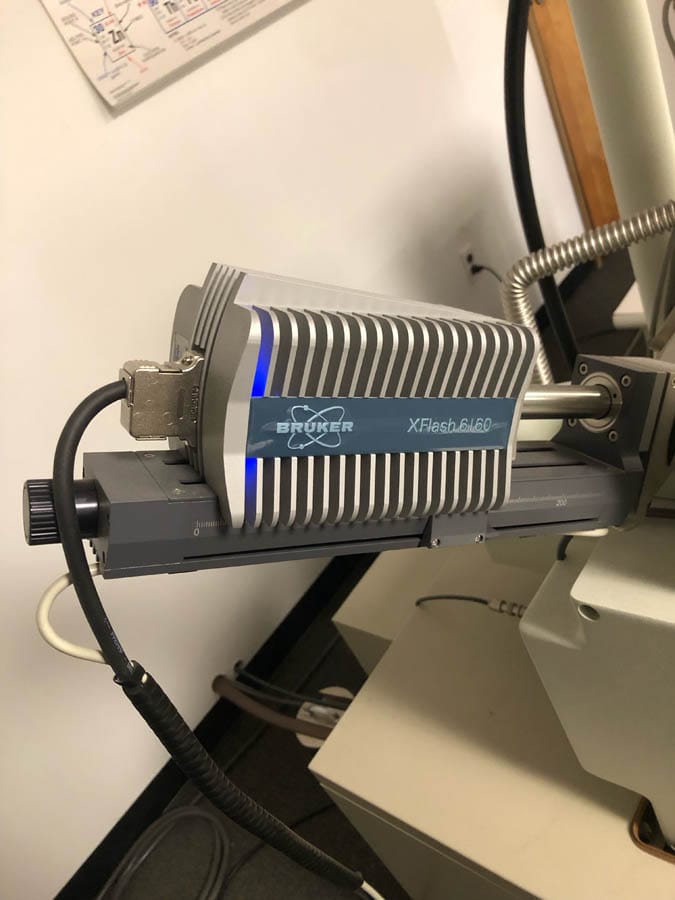
JEOL 6480 SEM
The JEOL 6480 SEM is equipped with a Bruker 6/60 Flash SDD detector (Boron to Uranium).
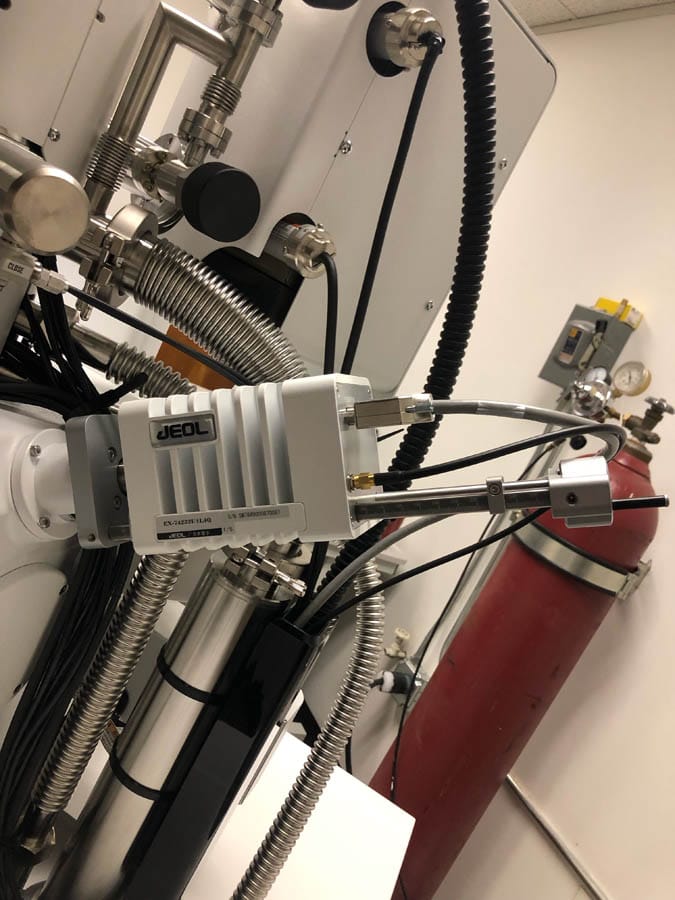
JEOL IT700HR
The JEOL IT700HR/LA FE-SEM is equipped with a JEOL SDD detector (Beryllium toUranium).

EDS is an attachment on the SEM and FE-SEM that can detect the energy of the x-rays coming from
the surface of the sample, when energized with an electron beam. The energy of the X-rays are specific
for each element in the periodic table. Both the SEM and FE-SEM systems at Micron Inc. utilize EDS
attachments.
Any solid materials such as metals, polymers, ceramics, pharmaceuticals, powders, corrosion products and much more.
JEOL 6480 SEM
The JEOL 6480 SEM is equipped with a Bruker 6/60 Flash SDD detector (Boron to Uranium).
JEOL IT700HR
The JEOL IT700HR/LA FE-SEM is equipped with a JEOL SDD detector (Beryllium toUranium).